Result Data
Storage Structure
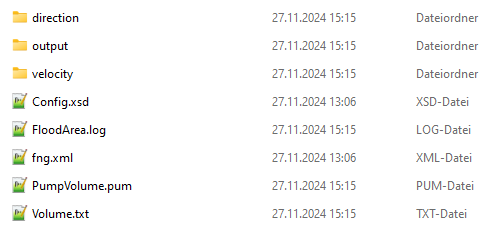
The type of storage determines the folder structure in the result folder. In the output folder are the result rasters with absolute water levels (Setting 1) or relative flood depths (Setting 3). The unit is meters. If Setting 2 or 4 has been selected, there are also the folders velocity with the flow velocity rasters (m/s) and the flow direction rasters direction (degrees with arithmetic orientation).
The number of rasters depends on the calculation duration and the storage interval. Each raster represents the system state at the time of storage, like a screenshot. With a 60 second interval, every 60th second would be written out. No interpolation, summation or similar takes place during storage.
Note: If the storage intervals are very long, there may be a loss of information; for example, if the discharge from a side valley occurs between two storage events. Output rasters are always in GeoTIFF (.tif) format. Besides the raster, there exists an XML file for each output raster. Here the metadata with the model parameters are stored. These are important if you want to continue a simulation with a continuation raster.
Output rasters are always in GeoTIFF (.tif) format. Besides the raster, there exists an XML file for each output raster. Here the metadata with the model parameters are stored. These are important if you want to continue a simulation with a continuation raster.
Reading Pump Volume
During the simulation, the amount of water that is removed at a coordinate is written to a separate file (PumpVolume.pum) in each simulation interval. The file PumpVolume.pum is written to the directory of the output folder.
The amount of water is the average value in the interval. It is written to the column of the ID of the coordinate at which water is removed.
The first line contains the ID of the coordinate (corresponding to the first column of the coordinate file). The first column indicates the time in seconds. The time steps correspond to the output interval of the simulation. In this example, an output raster was written every 5 minutes during the simulation. The amounts of water fed (positive) in or removed (negative) at the Koordinates are stored in the unit m 3/s .
Volume Balance
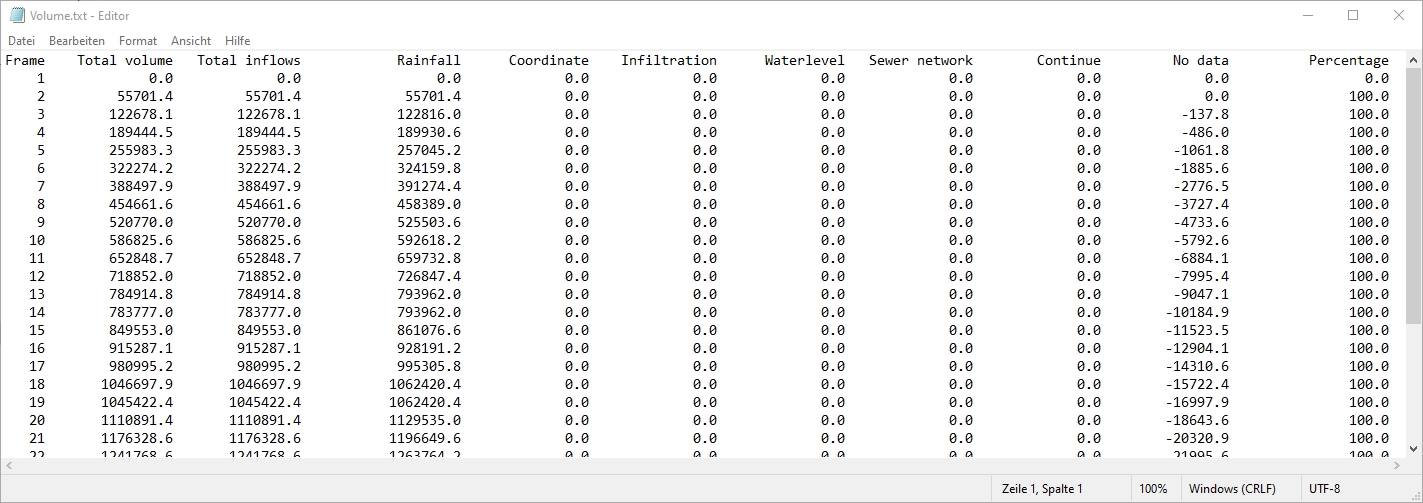
This file gives you an overview of how much water has been fed into the model and how much water has flowed out of or been removed from the system. The first column gives you the storage interval. The following two columns give the total amounts that have flowed into or out of the model up to a storage interval. Following this, the individual volumes are broken down e.g. by irrigation, pumps (coordinate) or infiltration. An important quantity here is also how much water has flowed into the NoData areas. This also includes water that has left the simulation area at the model boundaries.
Through the precise breakdown of the flows according to their origin, it is possible to achieve volume balances of nearly 100%.
Control File and Config.sys
If you start a simulation via ArcGIS Pro or ArcMap, an fng.xml and the Config.xsd are saved in addition to the result data. The fng.xml contains all input parameters and paths. If you want to repeat or continue the simulation at a later time, you can do this via the command line.


