Toolbox
With the FloodArea-Toolbox it is possible to use the functionalities of the FloodArea toolbar via the Arc-Toolbox. Herefore, the license file have to be specified in the certain dialog field of the floodarea toolbar.
Activation
The initialization takes place automatically with the installation of FloodArea. Before the toolbox is available in ArcMap or ArcCatalog, it must be loaded from the installation folder of FloodArea using the methods common in ArcGIS.
Start FloodArea
With the toolbox, all possibilities are available to start a calculation with FloodArea, which can also be used for other script tools. Batch operation is also possible. The simulation requirements are explained in the chapter Input data.
remark
If FloodArea is started by Toolbox and the ArcMap-project is crashed or the user is closing the FloodArea-dialog manually, FloodArea continues to run. Cancellation is then only possible via the Task Manager (Keyboard shortcut [Strg]+[Alt]+[Entf]).
The following explanation of the parameters also refers to the structure of the file fng.xml (see Starting FloodArea via the XML ) and the GUI.
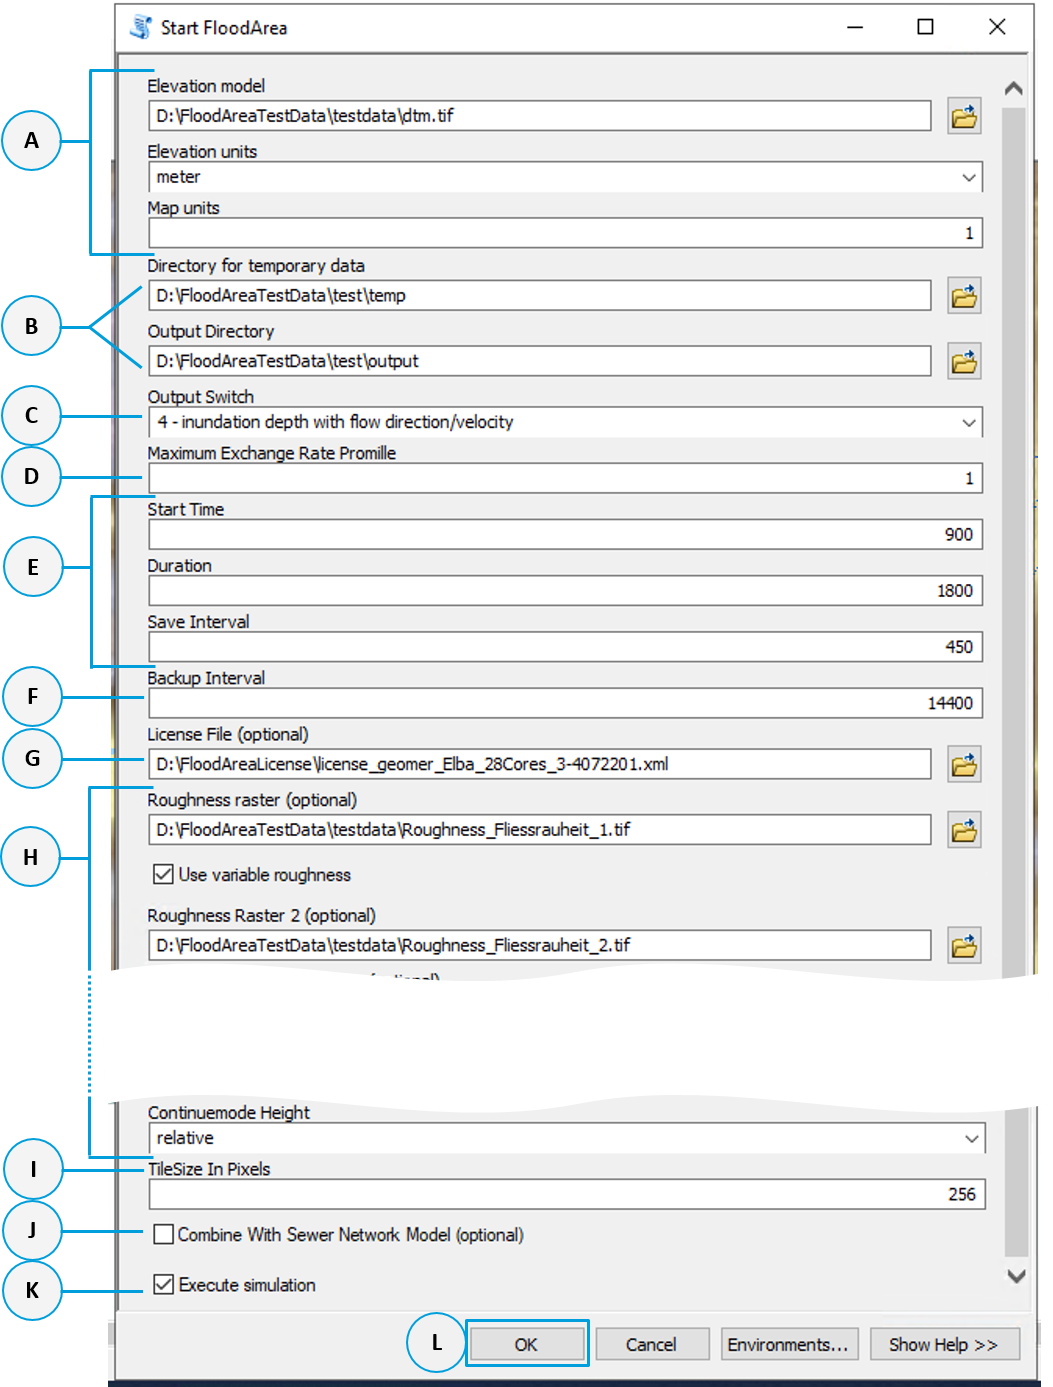
Field A: Basic data
Specification of the path to Digital Elevation Model (DEM) for the area of interest, value units and the cell size. This information have to be specified for each simulation.
XML: Paths - DTM_ras, General Settings - ElevationUnits and RasterUnits. GUI: Basic Data, the map unit (Map Units) is read automatically.
Field B: Output Paths
Here the paths for the temporary data and the simulation results are set. The fng.xml is stored in the folder for the temporary data (see Starting FloodArea via XML ). Simulation results will be stored in the newly created subfolders within the output folder named „output“ (flood depth), „velocity“ (flow velocity) and „direction“ (flow direction). The output grids get an „o“, „v“ or a „d“ at the beginning of the file name. The FloodArea log file is also written to this path. If the calculation option Pointinput is activated, the file PumpVolume.pum is stored here as well- see Read out pump volume.
XML: Output_dir and Temp_dir GUI: under additional settings - output options
Field C: Type of output
1 = Inundation depth at water level position in absolute height (m a.s.l.) 2 = Inundation depth at water level in absolute height (m a.s.l.) + flow velocity and flow direction 3 = Inundation depth in flooding depths in relative height (m) 4 = Inundation depth in flooding depths in relative height (m) + flow velocity + flow direction
XML: GeneralSettings - OutputSwitch GUI: under additional settings - output options
Field D: Maximum exchange rate
The Maximum exchange rate specifies the maximum amount of the current cell content that can be passed on to the neighboring cells in one iteration step. This is specified in Promille. The value indirectly influences the simulation speed, since the model reduces the duration of the iteration interval to fulfill this condition. If the values specified here are relatively large, a „ripple“ can occur in the model depending on the environmental conditions. These instabilities do not lead to a termination of the simulation run, but in extreme cases they can lead to an interruption of the simulation run due to too high water levels in single cells falsifying the results. Tests show that values between 1‰ and 5‰ give the best results. The smallest possible input value is 1 ‰. Larger exchange quantities (up to a maximum of 100 ‰) only make sense, if you want to reduce the simulation time significantly i.e. for a preview or presimulation run. For this purpose, it is advisable to calculate with a lower raster resolution of input data.
XML: GeneralSettings - MaxExchangeQuantityPromille GUI: under additional settings - calculation options
Field E: Simulation time and titme interval for storaging
All times given in seconds; in the toolbox and as well as the XML file. The start time of the simulation is normally set to 0, unless you want to continue a simulation (Continue Calculation). The Save Interval corresponds to the interval in which simulation results are saved (intern simualtion not processing time interval).
XML: TimeSetup (in seconds) GUI: under additional settings - Save interval and calculation duration (in hh: mm: ss)
Field F: Backup interval
FloodArea HPC 11 creates backup files during simulation. Reruns of a simulation can be started from the most recent backup file of the calculation. This file is stored in the output directory. If a calculation was not completed successfully, e.g. due to a user abort, the simulation can be restarted from the last backup. If a backup file from a previous calculation is available in the specified temp folder, it is automatically taken to start the new calculation.
remark
If a simulation was finished at 80 % of the calculation and the last backup was saved at 75 % of the calculation, a new calculation based on the backup file is continued at 75%.
This only happens if the same output directory is specified for the new calculation. The default value for the backup interval is 3600 and is interpreted as seconds of the processing time. Only the current backup file is retained. Depending on the kind of simulation, it may be useful to adjust the backup interval. In this case the value for the backup interval can be specified in the toolbox.
In the GUI a backup is written every 14400 seconds of processing time (every 4 hours).
XML: TimeSetup - Backup Interval (in seconds) GUI: no manual entry possible
Field G: License file
The path to the license file is specified here.
XML: Paths - LicenseFile_xml GUI: under the GUI main menu under FloodArea License.
Field H: Calculation options
The data formats and specifications of the calculation options are explained in the respective chapter (Water level - Point injection - Irrigation - Optional inputs).
Field I: Size of tiles
FloodArea HPC 11 is parallelized. The area of intrest is divided into tiles during the simulation (tiling) and the tiles are distributed to the processor cores of the computing computer. The tile size determines how large the tiles are during the simulation. It can be adjusted according to the size of the simulation area and the performance of the computer. Regarding simulation performance it is recommended that the numbre is divisible by 8.
XML: General Settings - TileSizeInPixels GUI: no manual entry possible
Field K and L: Running the simulation
If the check mark Execute simulation is set, FloodArea HPC 11 is started immediately when OK is clicked (field L). If the check mark is not set, only the fng.xml is written to the folder for temporary files (field B). With this file, FloodArea can then be started from the command line (see Command line & Console).
Calculate discharge
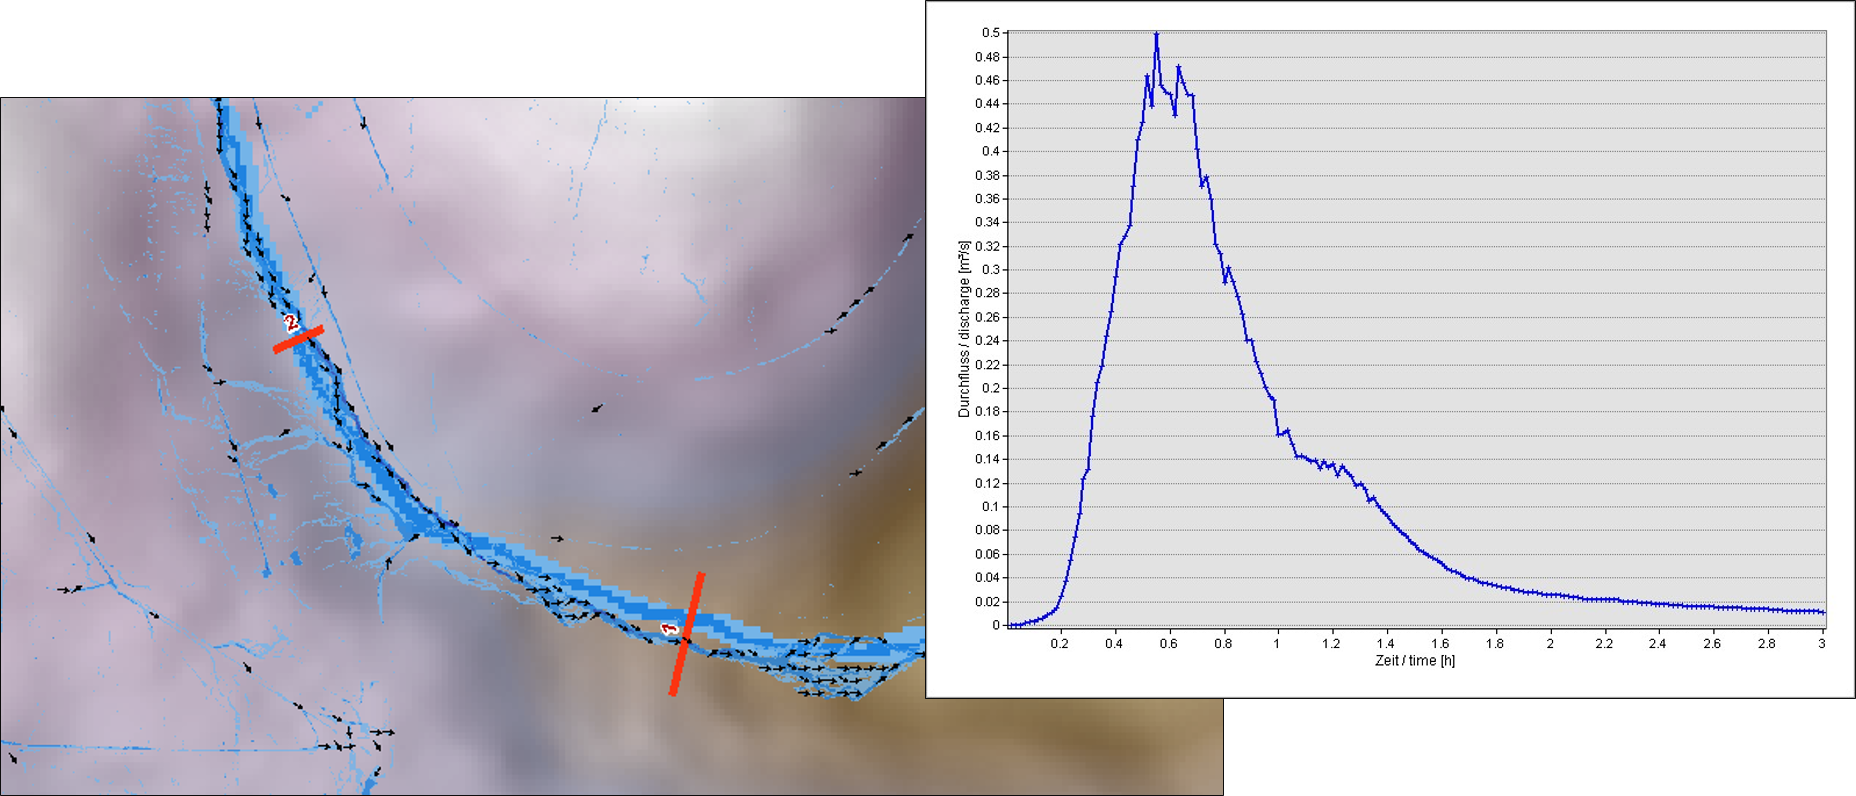
The Calculate Discharge function of the FloodArea Toolbox performs runoff hydrograph calculations using the simulation results. These can be used, for example, to determine the need for possible flood retention measures (volume, maximum discharge).
remark
This tool runs only in 32 bit. The Background Processing have to be deactivated. The height unit of the DTM (metre, centimetre or other) is not taken into account by the tool, but it is assumed that the simulation was done with metres. If the simulation was done with centimetres, millimetres, yards, feet or inches, the user has to convert the results himself.
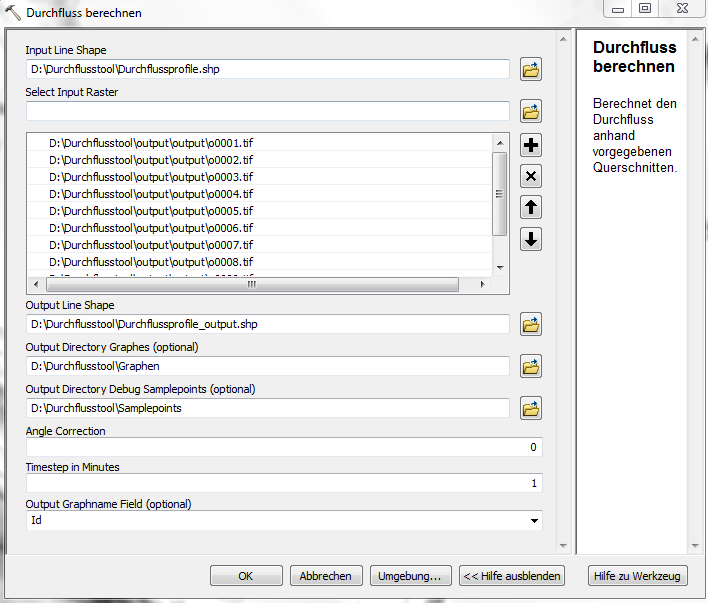
Input Line Shape
A line shapefile is required as input. The runoff is determined along these lines. When digitizing the runoff lines, ensure that there are unambiguous flow directions at this location without strong turbulence or backwater. To ensure that the runoff can be uniquely adressed to a line, the shape requires a column with an unique ID for each line (Output Graphname Field).
Select Input Grid
The calculation of the discharge requires the simulated inundation depths raters in the correct temporal order. Since the tool also needs the corresponding flow velocities and flow directions, which are accessed automatically, the folders output, velocity and direction must have the same structure as they are generated by FloodArea.
Output Line Shape
The calculate discharge tool generates a new shape file with runoff information for every time step in m 3 /s. Each time step gets a new column in the attribute table of this shape. Please consider the time step length that you set in the simulation if you want to perform calculations with the individual values.
Output Graphs
If a file path is specified in Output Directory Graphs, a disharge hydrograph graph is written out for every discharge line, which represents the flow over the simulation time. Using the data in the attribute table of the Output Line Shape, further values can be calculated (e.g. the average and maximum flow rate, sum of flow rate).
Export Results
If a file path is specified here for Output Directory Graphs, the entire results are written out as .csv files.
Further settings
The temporary Samplepoints that are set along the flow lines and through which the tool extracts the data, can also be saved by specifying a path under Output Direcoty Debug Samplepoint. For each time step a shapefile with the flow velocities and directions as well as the water depth or cross-section of the sample points is output. The AngleCorrection changes the flow directions systematically and should be set to 0. The TimeStep corresponds to the time step in which the grids were written out during the simulation (default = 1, if a grid was generated every 60 seconds / 1 minute).
Generate Hydrofiles
The tool runs in 64 bit - switch on the background processing. You can find this function in the geoprocessing options form ArcMap.
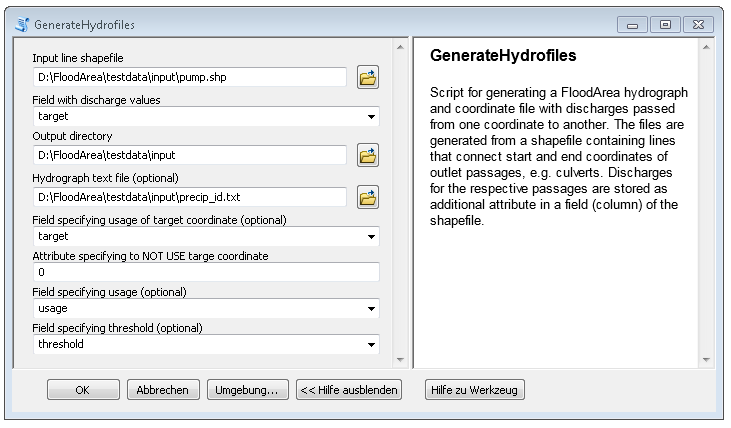
If the point injection is primarily used to pump water from A to B, so that culverts and permeable flow obstacles (e.g. bridges) are simulated, the coordinates and the inflow hydrograph file can be created with the tool GenerateHydrofiles in the ArcMap Toolbox FloodArea HPC 11. This tool GenerateHydrofiles automatically creates both text files based on a line shapefile.
remark
The tool is designed to extract water at one point and, if desired, to re-inject it at another point. Pure injection points have to be reworked manually. The pump characteristic curve is also not used. The last column of the coordinate file (switch for pump characteristic curve) is automatically set to 0 in the tool.
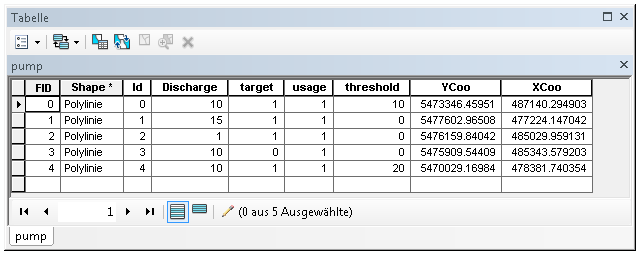
A line shape is created by connecting the extraction point and the feed point with a line. The digitizing direction of the lines is is very important (starting point = withdrawal, end point = injection point). Here is an example of an attribute table:
The ID, which is written into the first column of the Coordinate file, is reassigned according to the order of the FID (first column in attribute table). The amount of water that is pumped is in the column Discharge and is written in the Point-feed hydrograph (in m 3/s). The other specifications are optional.
The tool can be used as follows:
Hydrograph text file:
A hydrograph text file can be specified as template. The time steps (first column in each case) are then taken over.
Field specifying usage of target coordinate:
defines whether the extracted water quantity is fed in to the target coordinate (end point of the line) or is completely extracted from the simulation
Attributes specifying to NOT USE a targe coordinate:
Definition for the previous column (in this example: 0 = withdrawal of the water quantity, 1 = feeding at the target coordinate)
Field specifying usage:
When you are simulating different secenarios you can switch the pumping connection ON or OFF (via 0/1)
Field specifying threshold:
Attribute column with minimum water level from which water should be pumped first (specification in cm)
