Point input
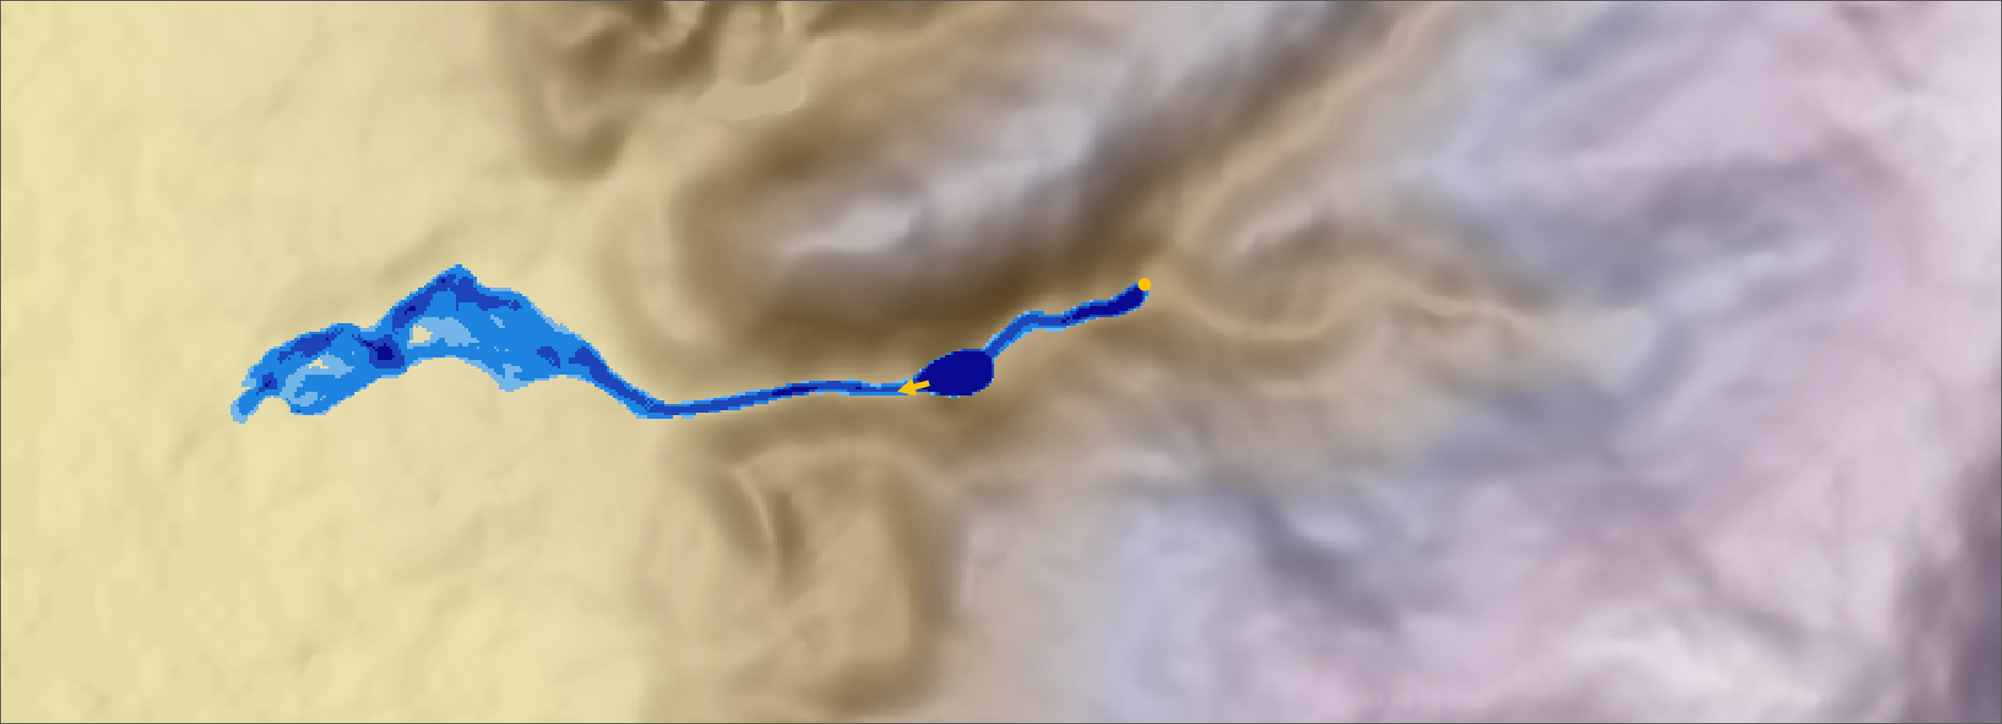
With the option points input hydrograph (in GUI only Hydrograph), water is injected or extracted at a specific coordinate in the model. There are three variants of point input:
the point input of water into the model,
the transfer of water quantities from one coordinate to another coordinate and
the selective removal of water from the model.
The respective water quantity is defined in a hydrograph and can vary over time.
A frequent application is the point input function in combination with the irrigation function, in order to depict realistic flow under complex conditions. For example if small-scale culverts are located underneath paths, large amounts of runoff will cause a build-up on the path. By means of a linear connection, the outflow quantity of a culvert can be taken out of the simulation in the front of the path (according to the culvert capacity) and fed back in the simulation behind the path. The preparation of the data for this application is also described at Tool Generate Hydrofiles.
Data formats point input
Required data:
Digital terrain model (GeoTIFF)
Points Input Hydrograph (.txt)
Coordinates (.txt)
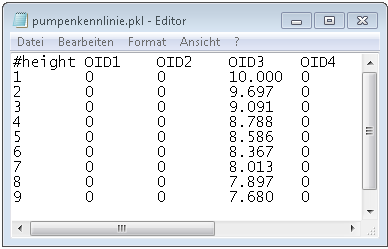
Optional pump curve (.pkl)
The structure of the three files is explained in the following chapters.
The actually pumped volume is written to the file PumpVolume.pum for each time step during the simulation (unit: m 3/s).
Note that water is pumped only as long as water is present at the initial coordinate of a linear connection. Furthermore, it should be noted that the point input is done at only one coordinate (in only one cell) and therefore a calculation is only possible with reasonable inflow quantities. If the discharge behaviour of a very large amount of water is to be modelled (for example for the discharge of a large river), the water fed into the system should be distributed over several cells, i.e., coordinates. An alternative possibility is to feed in the desired amount of water over a certain area (Irrigation mode).
Points Input Hydrographs
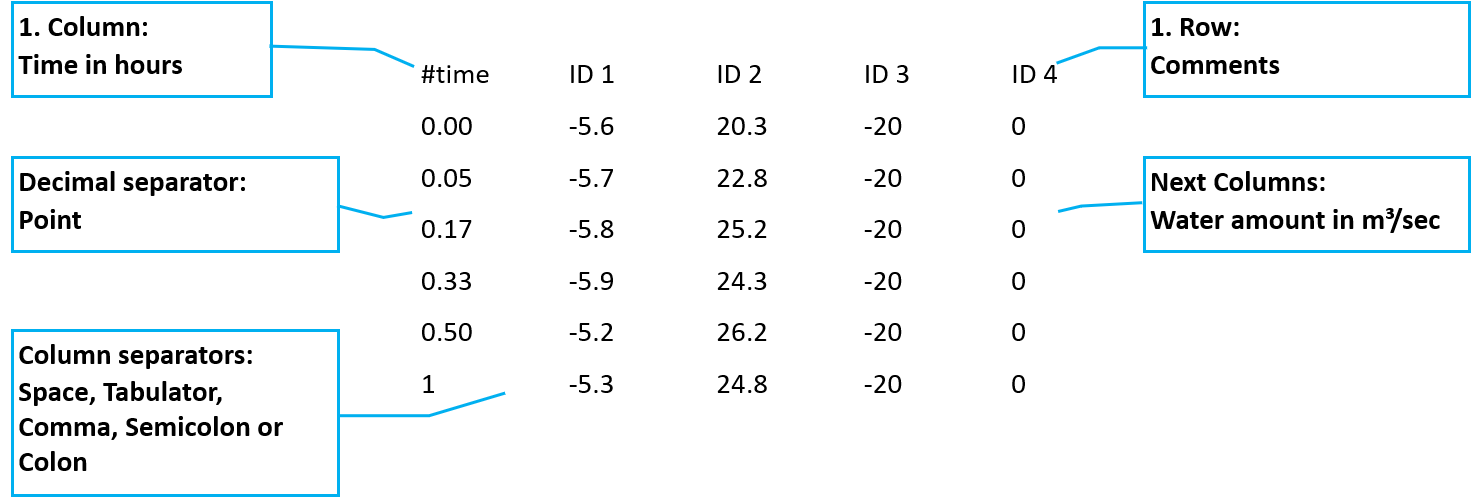
The text files for point input can be generated externally with any editor and must be available in text format with the file extension „.txt“. The file must correspond to the following format:
The file consists of at least two columns, where the first column contains the time intervals (unit: hours) and the second and all following columns contain the water quantity. The water quantity is given for each coordinate in m 3/sec. The water quantity can vary over time. Between the time steps (first line) is interpolated linearly.
Coordinate file
The file with the coordinates must be structured according to the following specification:
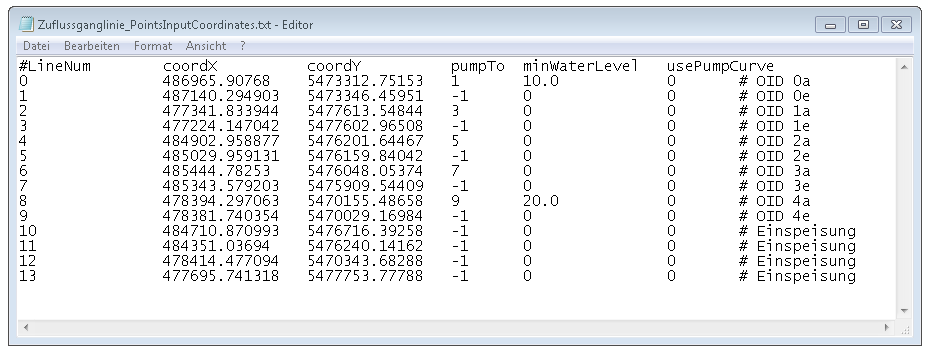
The first line is commented out (‚#‘) and contains the column names. The first column contains an internal system ID of the coordinate. This must be unique because it is used by FloodArea HPC 11. Therefore it should be counted from zero on. Own ID’s or notes can be commented out with a hash (#) at the end of the line.
The two following columns contain the coordinates for the input.
In the fourth column the ID of the target coordinate is written, into which water withdrawn at the corresponding withdrawal coordinate is fed back. The target coordinate must always appear in the list after the withdrawal coordinate, as the processing is sequential. If no water is to be withdrawn at a particular cell or withdrawn water is to be completely removed from the system, there is no target coordinate into which water is pumped. Therefore, the value -1 must be entered in this line for the target coordinate.
The fifth column in the coordinate file (minWaterLevel) contains the minimum water level in the respective cell. The minimum water level is always left in the corresponding cell and a withdrawal is only made when this water level is exceeded. The water level is given in cm with no decimals (relative to the surface, integer values). Other units are to be converted accordingly.
The sixth column contains a switch, which indicates whether the hydrograph file is to be used or whether a pump capacity is to be tapped by means of a pump characteristic curve. If this column contains a zero, the hydrograph is used normally, if it contains a 1, the value is taken from the pump characteristic curve.
caution
For each point input coordinate in the coordinate file, a column with discharge values must be available in the hydrograph file. Thereby the hydrographs from the file are assigned in their order to the input coordinates of the digitization. If the columns are missing in the file, no inflow is fed in. The same applies for missing input coordinates.
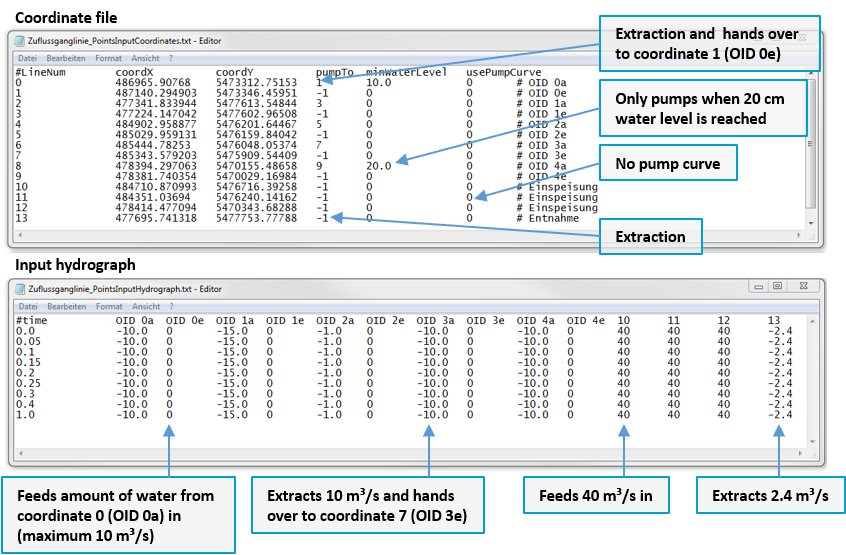
Only from the combination of the 4th column of the coordinate file (column pumpTo) and the corresponding Points Hydrograph file can be read, whether at the water is only taken from the model or fed in. The inflow or outflow quantities are specified by the given Point-input hydrograph file. In the first column the time is given in hours, followed by the quantities for the individual coordinates in order, where they are listed in the coordinate file.
Some possible combinations are shown in the following figure:
From these two files the following information can now be read, as an example
#LineNum 0 and 1: As soon as a water level of 10 cm is reached at the coordinate LineNum 0 (OID 0a), 10 m 3/sec is taken at the coordinate 0 and fed at the Kooirdinate 1 (OID 0e).
#LineNum 2 and 3: At the coordinate LineNum 2 (OID 1a) 15 m 3/sec is taken for the whole hour and is fed at the coordinate 3 (OID 1e).
#LineNum 10, 11 and 12: At these coordinates 40 m 3/sec are fed into the model over the entire hour.
#LineNum 13: At these coordinates 2.4 m 3/sec will be taken from the model for the entire hour.
Special function: Pump characteristic curve
currently under revision
this function is currently being tested - please ask us before using it!
The pump characteristics are given by a file named „FloodArea.pkl“. It is simulated that the pumping power increases with decreasing height difference between input and output point.
The last column of the Coordinate file contains a switch, which indicates, if the points input hydrograph file shall be used, or by means of a pump characteristic curve (see special function Pump characteristic curve) a flow rate (pump capacity) is to be tapped. If this column contains a 0, the hydrograph is used as usual, if it contains a 1, the value is taken from the pump curve.
The first column of the pump characteristic curve contains the height differences between the sampling cell and the feed cell in decimetres (dm). This column is only for orientation during creation and is ignored by the program. The permissible value range is 0 to 100 (i.e. 0 to 10 m). Negative values during the calculation run are set to 0, for values greater than 10 m the value 10 m is used. Each subsequent column contains, if required, the characteristic values for the pump used at the corresponding coordinate. In the example, values are therefore only entered for coordinate OID 3.
Read out pump volume
During the simulation, the amount of water taken at a coordinate is written to a separate file in each simulation interval. The file PumpVolume.pum is written into the directory of the output folder.
The water quantity given in this file is the mean value of the specific interval (unit m:sup:3/s). It is written to the column with the ID of the initial coordinate (the coordinate where water is taken out).
The first line contains the ID of the coordinate (corresponding to the first column of the Coordinate file ). The first column indicates the time in seconds. The time steps correspond to the output interval of the simulation. In this example an output grid was written out every 5 minutes during the simulation.
Testdata Point Input
test data for this option:
PointsInputCoordinates_PunkteinspeisungKoordinaten.txt
PointsInputHydrograph_PunkteinspeisungGanglinie.txt
