Rainstorm
In the case of the rainstorm variant, the terrain is irrigated with a specified precipitation pattern over a large area. The discharge index, the amount of precipitation and the precipitation pattern can hereby vary in space and time.
The simulation of a ordinary precipitation, a torrential rainfall or a continuous rain event is the typical application of this calculation option. The duration of the precipitation event can be selected freely. The part of the precipitation that comes to runoff is controlled by discharge index grids. Via the spatially and temporally variable input of rainfall hydrographs and discharge index grids, it is possible to simulate real precipitation events on the basis of radar data, or measured values from ground stations.
Rainstorm data formats
Required data:
Digital terrain model (GeoTIFF)
Discharge index grid (GeoTIFF in float)
Rainfall Hydrograph (.txt)
Optional: File for changing the runoff coefficient over time (.txt)
Optional: Raster for subdivision of the area (GeoTIFF with unsigned integers)
The discharge index grid specifies how much precipitation comes to runoff on surface. The precipitation is defined in a text file (in QM/S or MM/H) via one (or more) Rainfall Hydrographs and is valid for the whole area.
The spatial variation can be achieved by normalizing and weighting the precipitation quantities over the grid cells in the discharge index grid. The product of the precipitation intensity (in the hydrograph) and the value in the respective pixel of the discharge index grid results in the effective surface runoff.
Areas without precipitation contain a ‚0‘ or ‚NoData‘ in the discharge index grid (both are working). So if the discharge coefficient grid contains the value 0 or NODATA, no water is supplied in this area. If no modification of the hydrograph is intended, each cell in the discharge coefficient grid must have a value of 1. Negative Values are not allowed in the grid.
Rainfall Hydrograph
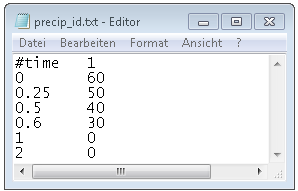
The text files can be generated externally with any editor and must be provided in text format with the file extension „.txt“. The files must be in the following format:
The first line is commented out (‚#‘) and contains the column names. The first column contains the time in hours. The time must at least correspond to the duration of the simulation. Errors occur if, for example, 3 hours are simulated, but the time only goes up to 2 hours. The second column contains the rainfall hydrograph in the unit mm/h (alternatively in m 3/s ). The precipitation intensity is indicated for each time interval (as a positive number). Between two time steps the rainfall intensity will be interpolatied linearly.
Conversion between m 3 /s and mm/h:
In many respects, the two hydrograph options (i.e. points input or irrigation) are similar. If a raster layer with only one single raster cell is specified for the flat feed, the results are identical to those of a point input at this coordinate. However, in this case, the units of the hydrograph must be converted into mm/h. Please note, that the conversion factors depend on the grid spacing, the feed-in of the quantity indicated in the hydrograph is done per grid cell. Here some selected values:
The inflow of 1 m 3 /s corresponds to
This conversion takes place automatically if the switch inflow quantity in m 3/s is active. If the inflow quantity in m 3/s is active, the water quantity indicated in the hydrograph file is distributed to all grid cells of the discharge index grid. Cell values in this grid are used as weighting, but the total amount of water supplied is not modified.
It is important for the simulation that the hydrograph contains a sufficient amount of precipitation. We use the image of a bucket that is filled by FloodArea with the precipitation of the hydrograph. This bucket with water is only poured into the system (the output-grids) when 1 mm is reached in the hydrograph. This is numerically necessary, especially in order to work volume-faithfully between the iteration steps and at the same time to enable a realistic flow field propagation. If the hydrograph always shows only a 1, the „bucket“ is only tipped into the output grid once per simulation-hour. For the accuracy of the model at low water volumes, see also chapter Limitations.
Change discharge index over time
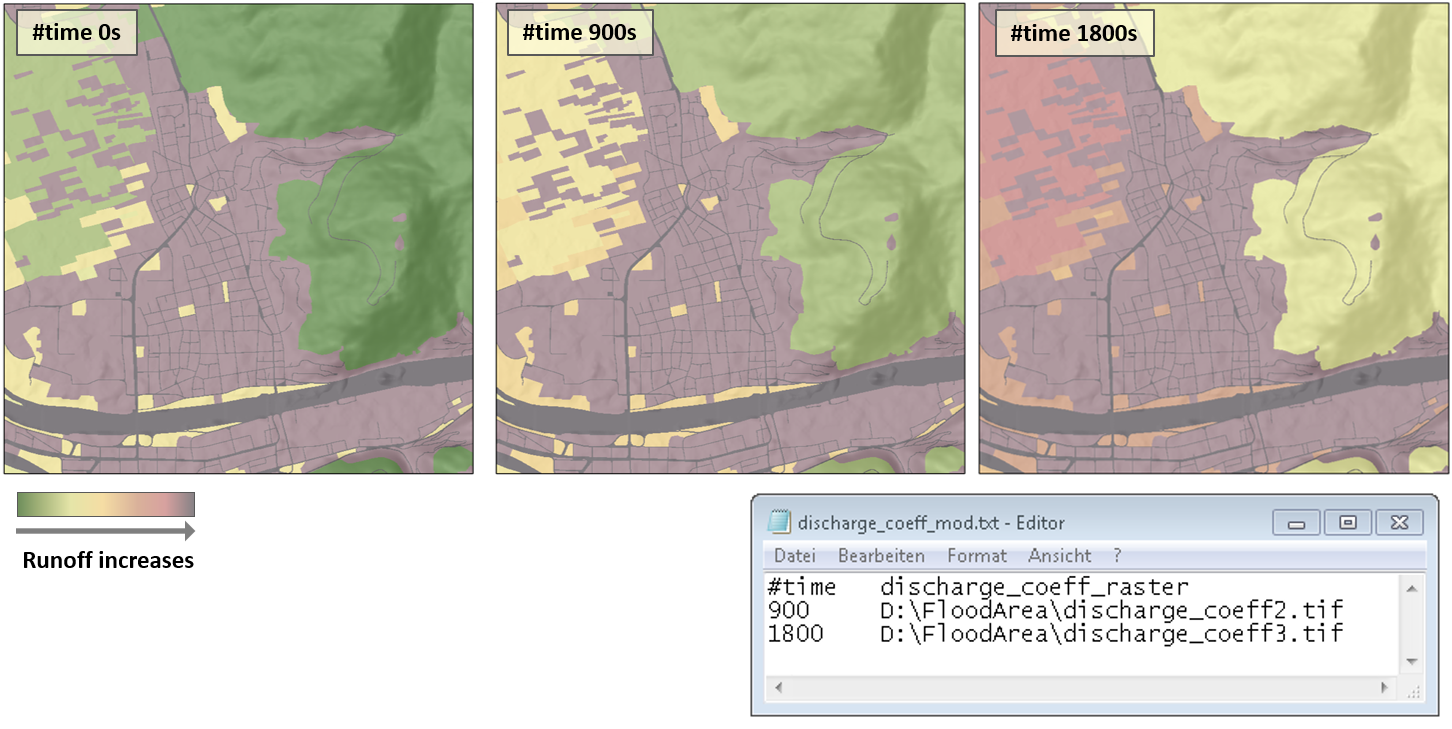
Discharge index change over time during a precipitation event. To illustrate this, several (any number of) discharge index grids can be loaded into the simulation one after the other.
The temporal exchange of the discharge index grids is defined in a text file. This file can be created externally with any editor and must be in text format with the file extension „.txt“. The files must correspond to the following format:
The first line is commented out (‚#‘) and contains the column names. In the first column, the time is given in seconds (note: for most other files, this is hours). The second column contains the paths to the discharge index grids. Since the first discharge index grid is given directly, only the subsequent discharge index grids are given here.
Multiple Rainfall Hydrographs
To simulate inhomogeneous precipitation, several hydrographs can be fed into the simulation. If a real rainfall event is to be simulated on the basis of collected data from several precipitation measuring stations, this option can be used.
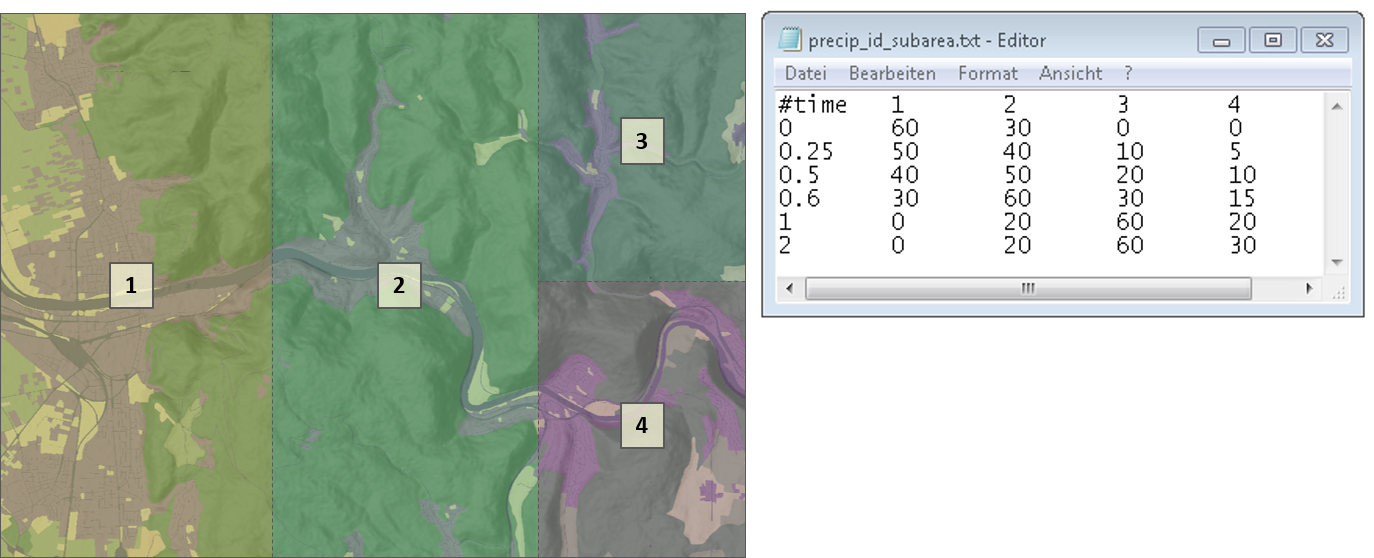
For this purpose, a grid with Index of subdomains of the irrigation area as well as several hydrographs in the Rainfall Hydrograph textfile are required. The Rainfall subarea index raster have to contain only the ID of the Rainfall Hydrograph, with unsigned integer numbers.
The multiple rainfall hydrograph’s have to be same as the Rainfall Hydrograph and are written into the same file in the following columns. The order of the hydrographs must correspond to the order of the ID’s in the grid, because not the ID’s itself but only the order is read in by FloodArea.
The ID’s of the subarea index raster and in the rainfall hydrograph text file must be identical, start at 1 and be continuous (1, 2, 3, …).
If the IDs do not follow one another, the error message Exit-Code [-602]; Subarea rainfall index is out of range appears. If the spatially different irrigation is activated, but only one hydrograph is entered in the hydrograph file, no error message will be displayed. As in this case FloodArea considers only one subdomain for rainfall simulation. Wherever no subarea ID is defined in the subarea index raster, the first hydrograph is used (as long as there is a discharge coefficient there).
Testdata Rainstorm
test data for this option:
DischargeIndex_Abflussbeiwert.tif (4 pieces)
RainstormSubdomains_BeregnungsTeilgebiete.tif
RainfallHydrograph_Beregnungsganglinie.txt
RainfallHydrographSubareas_BeregnungsganglinieTeilgebiete.txt
RainfallSwitchTimes_BeregnungWechselzeitpunkte.txt


